Virtual Agent Analytics Overview: Conversations Chart
This document explains Conversations which features two line-charts: All Conversations and Coverage. You can switch between the charts through the Select Type dropdown.
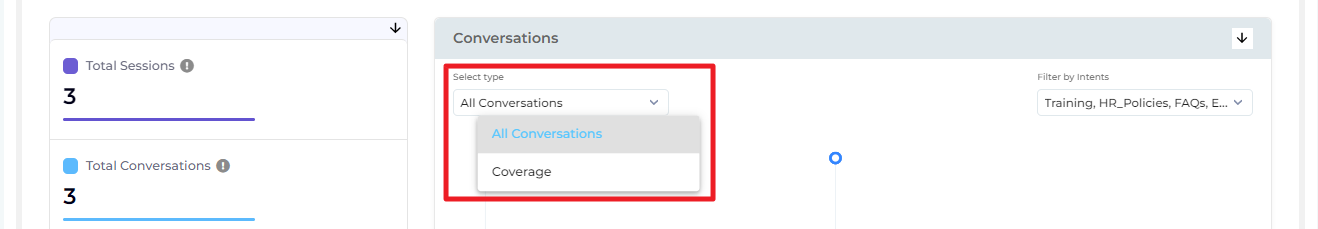
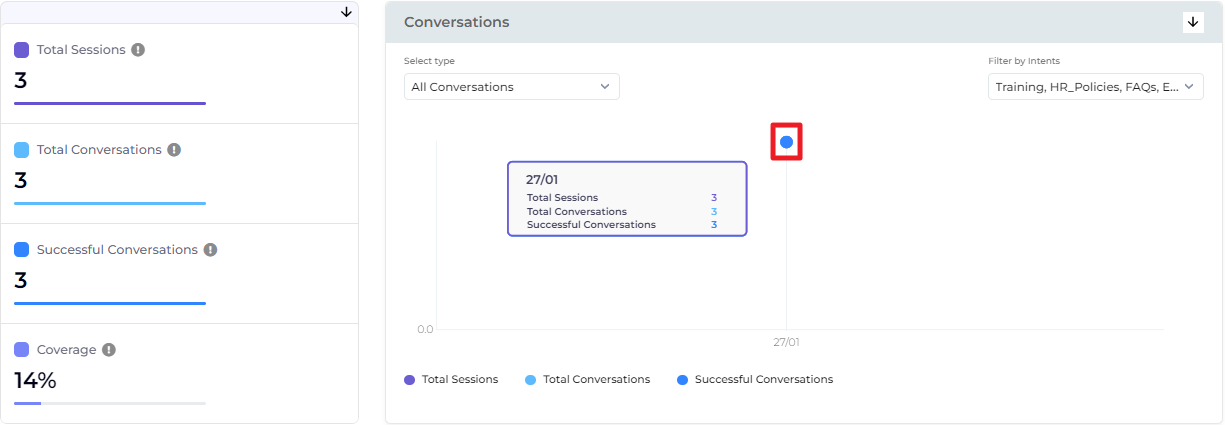
All Conversations
Conversations plots Total Sessions and Total Conversations against time. Along the x-axis is flexible time in hours (if Date Range is a Today or Yesterday) or days (if Date Range is Last 7 Days, Last 30 Days, This Month, Last Month, or a Custom Range shorter than 3 months). Along the y-axis are Total Sessions and Total Conversations.
On hovering the cursor over a point, you can view the exact Total Sessions and Total Conversations, along with the time of their happening.
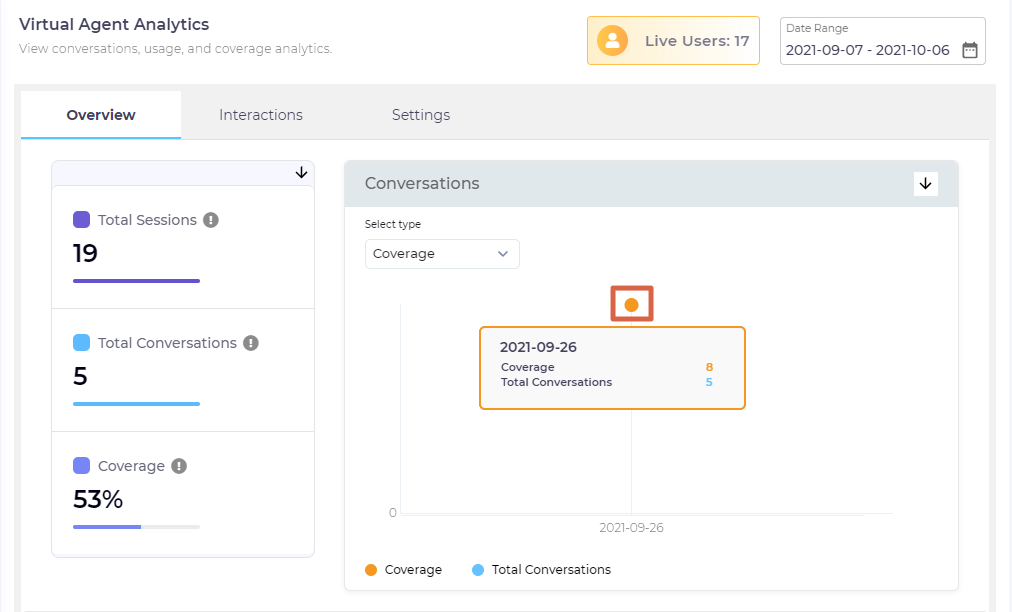
Coverage
The chart Coverage plots Coverage and Total Conversations against time. Along the x-axis is flexible time in hours (if Date Range is a Today or Yesterday) or days (if Date Range is Last 7 Days, Last 30 Days, This Month, Last Month, or a Custom Range shorter than 3 months). Along the y-axis is Coverage and Total Conversations .
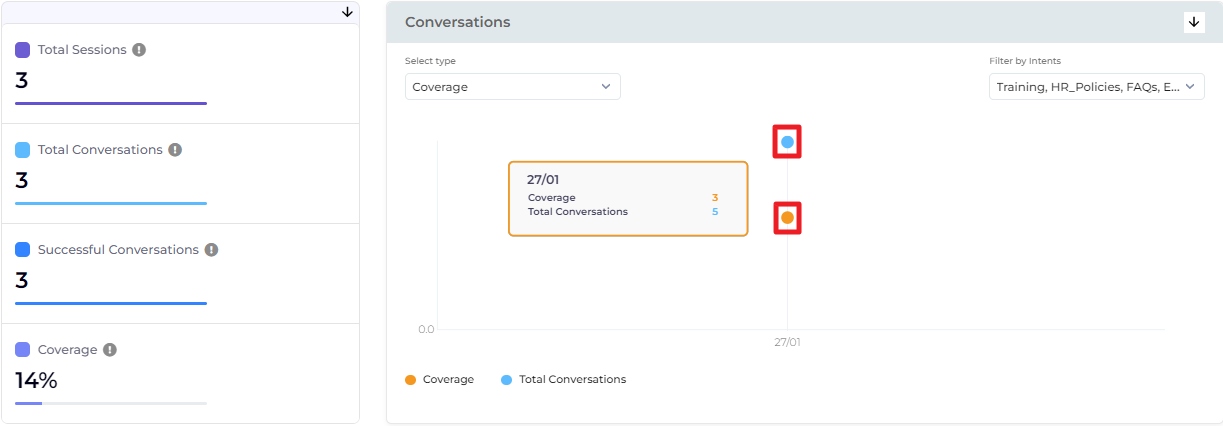
On hovering the cursor over a line, you can view the exact Coverage and Total Conversations, along with the time of their happening.
Configure Charts
Despite the images used, the configurations apply to both charts: Top Conversations and Coverage.
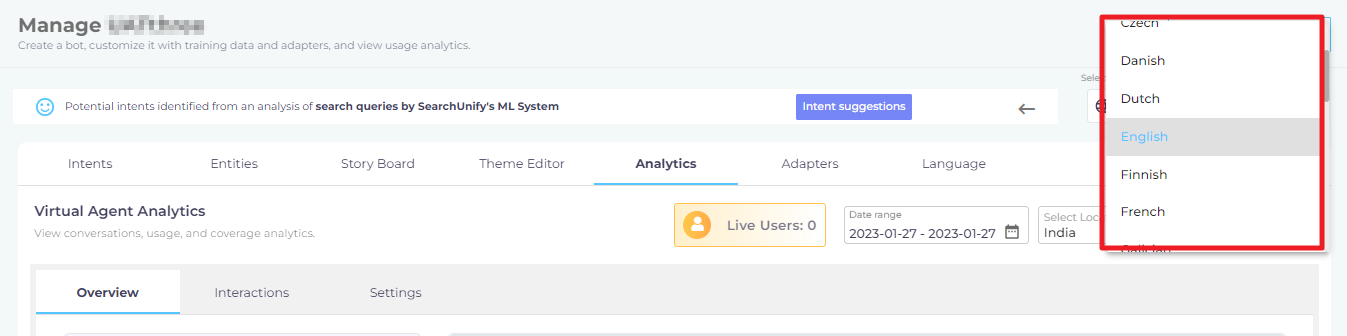
In the default set-up, all data is only for the language visible in the Select Language dropdown. For a multilingual virtual agent, such as one in English, Spanish, and Chinese, Analytics shows the data only for one language. In the next image, the data you see is for English.
It's possible to change the data to another language from the dropdown.
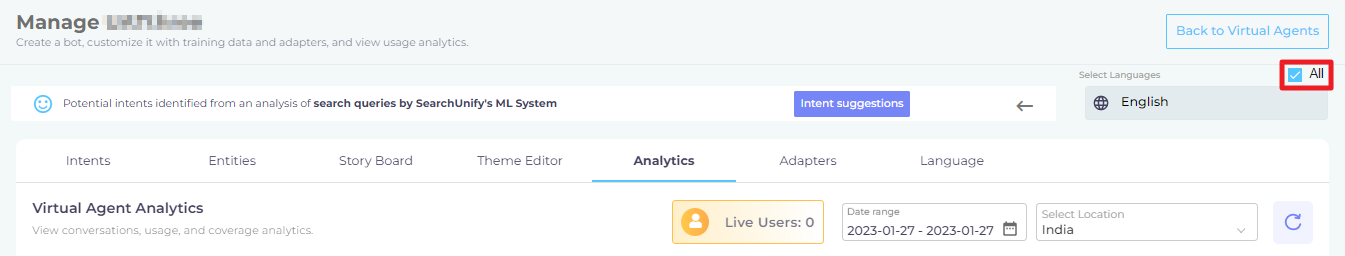
To view data for the entire virtual agent, irrespective of the language, check All.
When the data is much, a horizontal scroll can be used to view the entire chart.
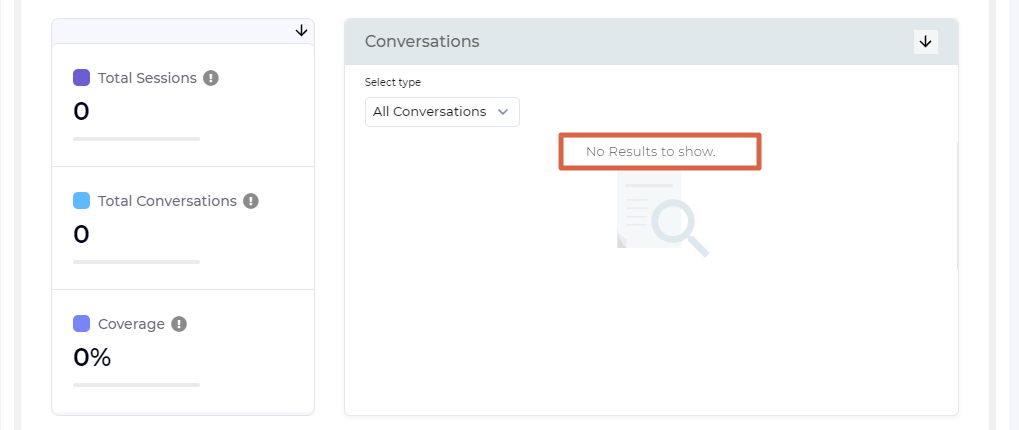
Conversely, when there is no data, which can happen when the virtual agent is new or the Date Range is extremely short, you get an error message.
Download or Share
To download the conversations data, click ![]() on the top right of the tiles section.
on the top right of the tiles section.
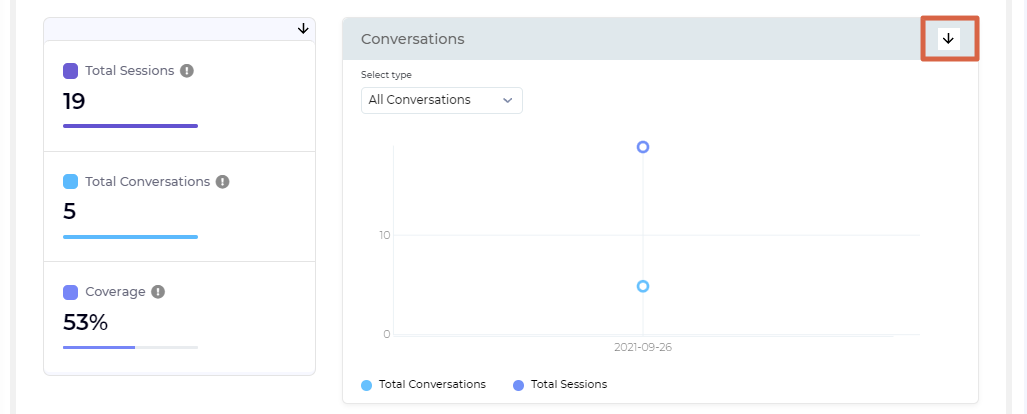
The report is downloaded as a Analytics_All_Conversations.csv.
Delete this text and replace it with your own content.