SearchUnify Virtual Assistant (SUVA) Dashboard
As an admin, when you log into the SUVA admin panel, you can see a dashboard showing the overall performance of the chatbot.
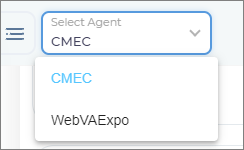
By default, the dashboard shows the report of the latest-created bot. However, you can change the agent to see the performance of the chatbot.
To get a quick overview of the virtual agent performance, the dashboard covers the following details:
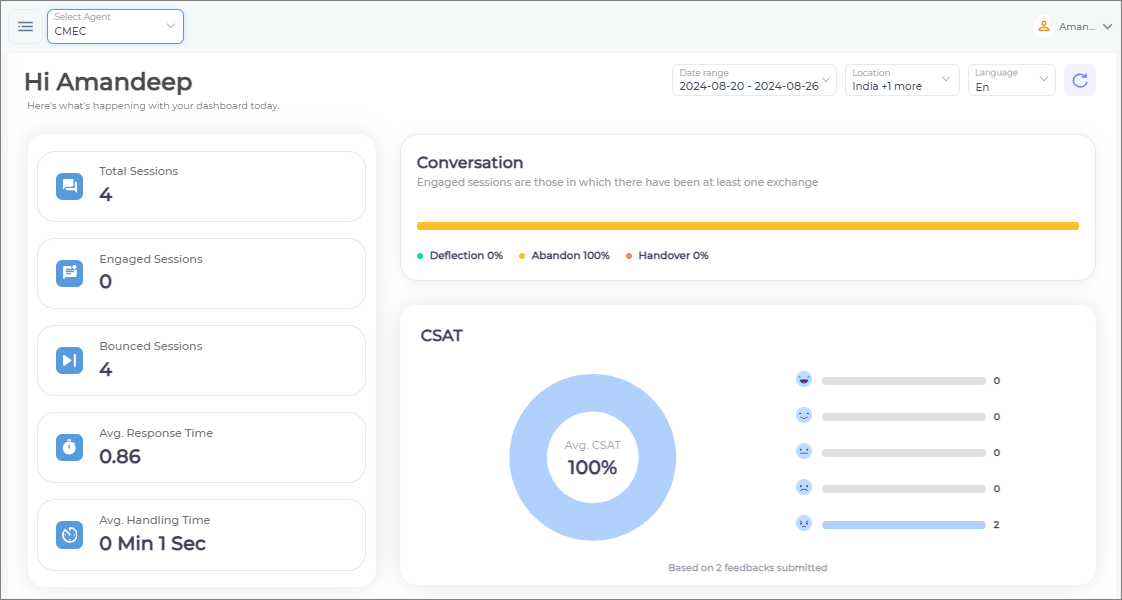
Total Sessions
The number of bot sessions in which the chatbot was launched at least once. A user can converse with the chatbot multiple times in a session without increasing the Total Session count. The count rises only when a user lands on the platform, where SUVA is installed, and a user launches the chatbot at least once before the search session expires.
Engaged Sessions
The number of bot sessions in which a user conversed with the chatbot by asking a query is counted as an Engaged Session.
Bounced Sessions
The number of sessions in which a user closed the chat window without any query is a Bounced Session.
Avg. (Average) Response Time
It shows the average time the chatbot took to respond to user queries.
Avg. (Average) Handling Time
It shows the average time that users spend while conversing with the chatbot.
Conversation
The color bar shows the percentage of deflected, abandoned, and handed-over conversations. The number of conversations can be the same or higher than the number of sessions as there could be more than one conversation in a session.
If a conversation will end up in a deflection, abandonment, or handover; it is decided as given below:
-
A conversation is considered deflected when an end user selects Yes to the message asking “Was this issue resolved?” or responds in an affirmative response.
Note. Selecting No or a negative response triggers the Negative Feedback Path story configurable from Story Board.
-
If a user doesn't respond to the “Was this issue resolved?” message and the sessions get terminated after manually closing the chatbot or 60 minutes of inactivity, the conversation is considered abandoned.
-
When an end user creates a case or connects to a live agent, the conversation is considered a handover.
CSAT
You can see the chat session responses submitted by your chatbot users. The formula to calculate the CSAT percentage is:

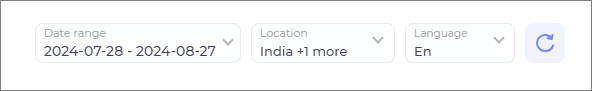
There are three additional filters to sort the report.
-
Date Range
Each tile and report in Analytics displays data for the period specified in Date Range, which can be as short as a day and as long as six months.
-
Select Location
This filter is used to segment and view analytics by country. It is largely helpful for SUVA admins to get the data of the users based on their geolocation and thus, understand user traffic from specific regions.
By default, all the countries are selected. You can remove or select countries based on your preference.
-
Language
This filter is used to segment and view analytics by language. By default, all the languages are selected.
Refresh Button
Click on the  button to refresh the report data on the dashboard.
Last updated: Friday, July 17, 2026