Overview: Analyze Your Chatbot's Performance and CSAT
The Overview report gives admins a look into the performance of your chatbot (virtual agent), including the number on sessions, conversions, and CSAT. Based on the selected Agent, Location, and Date Range, you will see the below-mentioned details.
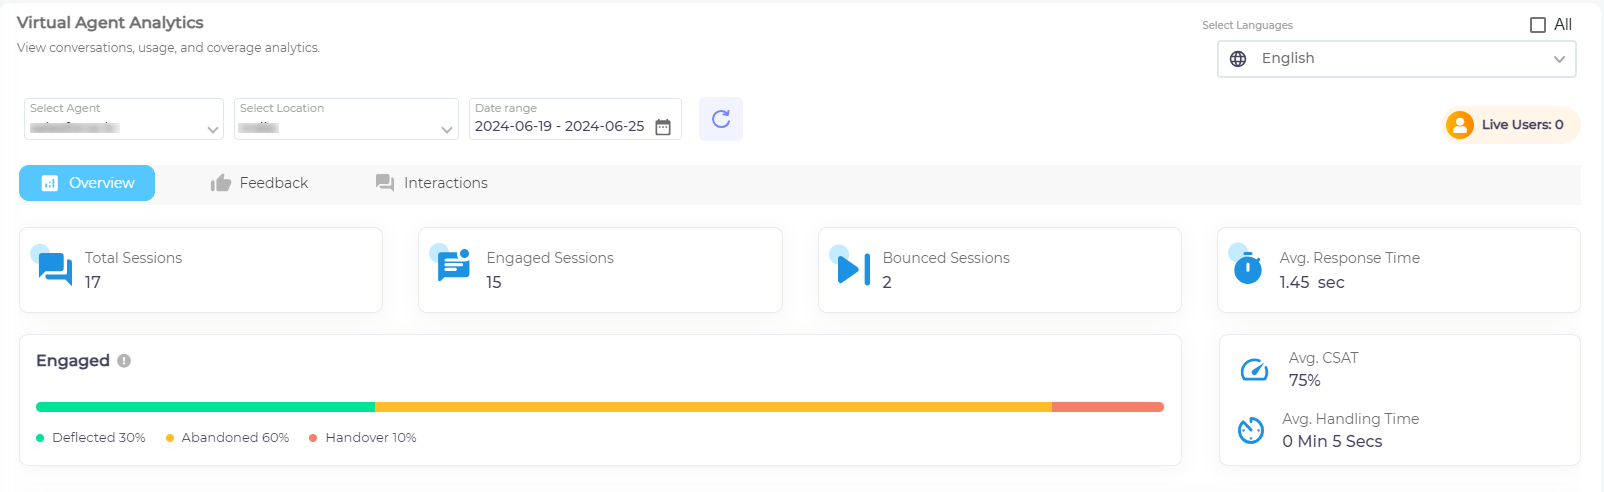
The details of what each parameter indicates are as follows:
-
Total Sessions
The number of bot sessions in which your chatbot was launched at least once. A user can converse with your chatbot multiple times in a session without increasing the Total Sessions count. The count increases only when user lands on the platform, where SUVA is installed, and a user launches your chatbot at least once before the search session expires.
-
Engaged Sessions
The number of bot sessions in which a user conversed with your chatbot by asking a query is counted as an Engaged Session.
-
Bounced Sessions
The number of sessions in which a user closed the chat window without asking any query is considered as a Bounced Session.
-
Avg. (Average) Response Time
It shows the average time that your chatbot took to respond to user queries.
-
Engaged
The color bar shows the percentage of deflected, abandoned, and handed-over conversations. The number of conversations can be same or higher than the number of sessions as there could be more than one conversations in a session.
Given below is how it is decided if a conversations will end up in a deflection, abandonment, or handover:
-
A conversation is considered deflected when an end user either selects Yes to the message asking Was this issue resolved? or responds in an affirmative response .
Note. Selecting No or a negative response triggers the Negative Feedback Path story configurable from Story Board.
-
If a user doesn't respond to the Was this issue resolved? message and the sessions gets terminated after 60 minutes of inactivity, the conversation is considered abandoned.
-
When an end user creates a case or connects to a live agent, the conversation is considered a handover.
-
-
Avg. (Average) CSAT
The formula to calculate average CSAT percentage is:

-
Avg Handling Time
It shows the average time that users spent while conversing to your chatbot.
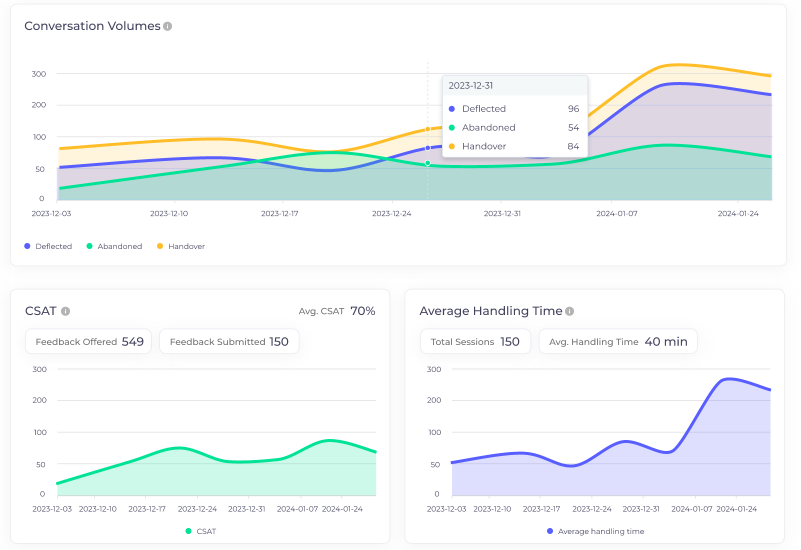
Scrolling down shows three more sections; Conversation Volumes, CSAT, and Average Handling Time.
-
Conversation Volumes
It shows a line graph with the number of sessions on the Y axis and the dates on the X axis. Three different color lines shows different aspects; A) Deflected Conversations, B) Abandoned Conversations, and C) Handover Conversations.
This graph provides a complete picture and the basis on which the Engaged (point 5) percentage is calculated.
-
CSAT
It shows a line graph with the number of sessions on the Y axis and the dates on the X axis. A color line shows the CSAT percentage of successful chatbot sessions. It is measured based on positive chat session feedback (Refer to the formula in the point 6).
-
Average Handling Time
It shows a line graph with the number of sessions on the Y axis and the dates on the X axis. A color-coded line shows the average handling time on a date for All Conversations.
Download and Email Reports
You can download the Conversation Volumes, CSAT, and Average Handling Time reports or send them as email to your inbox. The email is sent to the email you used to log into the SUVA admin panel.
Last updated: Friday, January 31, 2025